Electrify Chicago
An independent tool for viewing City of Chicago building data
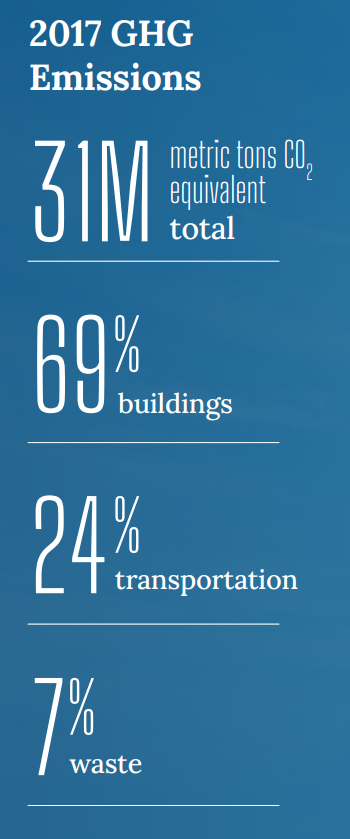
According to the
2022 Chicago Climate Action Plan ,
a whopping 69% of Chicago's emissions come from buildings, making it
our biggest challenge and our biggest opportunity as a city to tackle
change. At Electrify Chicago, we want to showcase some of the best and worst performing
buildings in the city using publicly available data and manual annotations to add
building photographs and label multi-building owners like universities.
,
a whopping 69% of Chicago's emissions come from buildings, making it
our biggest challenge and our biggest opportunity as a city to tackle
change. At Electrify Chicago, we want to showcase some of the best and worst performing
buildings in the city using publicly available data and manual annotations to add
building photographs and label multi-building owners like universities.
You can start by looking at Chicago's buildings with the highest greenhouse gas intensity - this means that they use the most energy when adjusted per unit of square foot, so big buildings could actually perform much better than very inefficient small buildings on this metric.
New Article
📰 $30 Million In Missed Fines
The City Of Chicago failed to collect $30 million in potential fines from the building benchmarking ordinance, reducing transparency and accountability.
Legislative update! 🎉
As of late January 2024, legislation is being introduced to require new use more efficient forms of water and space heating, via the Clean And Affordable Buildings Ordinance (CABO), which will reduce the number of highly polluting and inefficient buildings that end up on this site.
If you're in Chicago,
write to your alderman to support the CABO!
Chicago Buildings by Greenhouse Gas Intensity
Note: Data only includes large Chicago buildings from 2021, unless explicitly stated otherwise.
Note: This data only includes buildings whose emissions are reported
under the
Chicago Energy Benchmarking Ordinance. According to the City “As of 2016,
this list includes all commercial, institutional, and residential buildings larger than
50,000 square feet.” This dataset is also then filtered to only buildings with
reported emissions > 1,000 metric tons CO2 equivalent.
This data is also from 2021, but when new benchmark data is available, we'll update the site.
| Property Name / address | Primary Property Type |
Greenhouse Gas Intensity (kg CO2 eq./sqft) |
Total Greenhouse Emissions (metric tons CO2 eq.) |
|---|---|---|---|
|
300 North Elizabeth
300 N Elizabeth St
| Office | 16.8 kg/sqft
Highest 5%
| 2,154 tons
Highest 21%
|
|
Thorek Memorial Hospital
850 W Irving Park Rd
| Hospital (General Medical & Surgical) | 16.7 kg/sqft
Highest 5%
| 3,424 tons
Highest 11%
|
|
Ascension St Joseph Hospital - Chicago
🚩
2900 N Lake Shore Dr
| Hospital (General Medical & Surgical) | 16.7 kg/sqft
Highest 5%
| 11,411 tons
Highest 2%
|
|
Chicago Board Options Exchange
400 S LaSalle St
| Financial Office | 16.7 kg/sqft
Highest 5%
| 5,836 tons
Highest 6%
|
|
American Asia
4851 - 4887 N Broadway Ave
| Strip Mall | 16.6 kg/sqft
Highest 5%
| 1,021 tons
Highest 44%
|
|
Alden Estate of Northmoor
5831 N Northwest Hwy
| Senior Living Community | 16.5 kg/sqft
Highest 5%
| 1,382 tons
Highest 34%
|
|
WOODSON REGIONAL LIBRARY
9525 S Halsted St
| Library | 16.5 kg/sqft
Highest 5%
| 1,072 tons
Highest 43%
|
|
Advocate Center, Chicago Bulls Training Facility
15 S Wood St
| Other | 16.5 kg/sqft
Highest 5%
| 990 tons
Highest 46%
|
|
230 East Ontario St
230 E ONTARIO ST
| Multifamily Housing | 16.5 kg/sqft
Highest 5%
| 826 tons
Lowest 48%
|
|
8793
(Northwestern)
310 E Superior Street
| College/University | 16.2 kg/sqft
Highest 6%
| 989 tons
Highest 46%
|
|
St Bernard Hospital
326 West 64th St
| Hospital (General Medical & Surgical) | 16.2 kg/sqft
Highest 6%
| 5,731 tons
Highest 6%
|
|
Chicago-North
2544 W Montrose Ave
| Other - Specialty Hospital | 15.9 kg/sqft
Highest 6%
| 2,367 tons
Highest 18%
|
|
Noble Network of Charter Schools
1409 - 1443 N Ogden Ave
| K-12 School | 15.9 kg/sqft
Highest 6%
| 1,439 tons
Highest 33%
|
|
Warren Barr Gold Coast
66 W Oak St
| Senior Living Community | 15.9 kg/sqft
Highest 6%
| 2,141 tons
Highest 21%
|
|
Continental Nursing & Rehabilitation Center
5336 N Western Ave
| Senior Living Community | 15.9 kg/sqft
Highest 6%
| 809 tons
Lowest 47%
|
Data Source:
Chicago Energy Benchmarking Data