Electrify Chicago
An independent tool for viewing City of Chicago building data
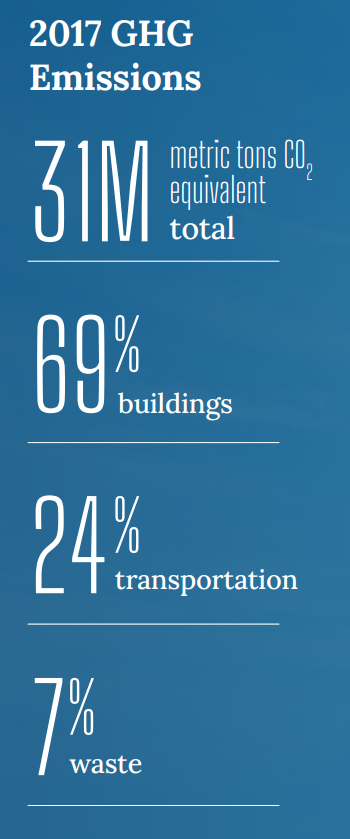
According to the
2022 Chicago Climate Action Plan ,
a whopping 69% of Chicago's emissions come from buildings, making it
our biggest challenge and our biggest opportunity as a city to tackle
change. At Electrify Chicago, we want to showcase some of the best and worst performing
buildings in the city using publicly available data and manual annotations to add
building photographs and label multi-building owners like universities.
,
a whopping 69% of Chicago's emissions come from buildings, making it
our biggest challenge and our biggest opportunity as a city to tackle
change. At Electrify Chicago, we want to showcase some of the best and worst performing
buildings in the city using publicly available data and manual annotations to add
building photographs and label multi-building owners like universities.
You can start by looking at Chicago's buildings with the highest greenhouse gas intensity - this means that they use the most energy when adjusted per unit of square foot, so big buildings could actually perform much better than very inefficient small buildings on this metric.
New Article
📰 $30 Million In Missed Fines
The City Of Chicago failed to collect $30 million in potential fines from the building benchmarking ordinance, reducing transparency and accountability.
Legislative update! 🎉
As of late January 2024, legislation is being introduced to require new use more efficient forms of water and space heating, via the Clean And Affordable Buildings Ordinance (CABO), which will reduce the number of highly polluting and inefficient buildings that end up on this site.
If you're in Chicago,
write to your alderman to support the CABO!
Chicago Buildings by Greenhouse Gas Intensity
Note: Data only includes large Chicago buildings from 2021, unless explicitly stated otherwise.
Note: This data only includes buildings whose emissions are reported
under the
Chicago Energy Benchmarking Ordinance. According to the City “As of 2016,
this list includes all commercial, institutional, and residential buildings larger than
50,000 square feet.” This dataset is also then filtered to only buildings with
reported emissions > 1,000 metric tons CO2 equivalent.
This data is also from 2021, but when new benchmark data is available, we'll update the site.
| Property Name / address | Primary Property Type |
Greenhouse Gas Intensity (kg CO2 eq./sqft) |
Total Greenhouse Emissions (metric tons CO2 eq.) |
|---|---|---|---|
|
Alice B. Sharp Building
37 S Wabash Ave
| College/University | 8.9 kg/sqft
Highest 20%
| 2,033 tons
Highest 22%
|
|
International Tower
8550 W Bryn Mawr Ave
| Office | 8.9 kg/sqft
Highest 20%
| 2,758 tons
Highest 15%
|
|
Cobb Hall
(UChicago)
5811 - 5827 S Ellis Ave
| College/University | 8.8 kg/sqft
Highest 21%
| 703 tons
Lowest 41%
|
|
Lake Meadows Shopping Center - (LA Fitness - Building 2)
3445 3481 S King Dr
| Fitness Center/Health Club/Gym | 8.8 kg/sqft
Highest 21%
| 533 tons
Lowest 29%
|
|
Cesar E Chavez Multicultural Academic Center ES
(CPS)
4747 S Marshfield Ave
| K-12 School | 8.8 kg/sqft
Highest 21%
| 602 tons
Lowest 35%
|
|
R. J. QUINN ACADEMY (FIRE)
558 W De Koven St
| Adult Education | 8.8 kg/sqft
Highest 21%
| 587 tons
Lowest 34%
|
|
Winchester Hood Garden Homes Trust R-704
1940 1960 W HOOD AVE
| Multifamily Housing | 8.8 kg/sqft
Highest 21%
| 644 tons
Lowest 38%
|
|
InterContinental
🚩
505 N Michigan Ave
| Hotel | 8.8 kg/sqft
Highest 21%
| 6,324 tons
Highest 5%
|
|
600 Fulton Owner, LLC
600 W Fulton St
| Office | 8.8 kg/sqft
Highest 21%
| 2,084 tons
Highest 22%
|
|
Newberry Library
60 W Walton St
| Library | 8.8 kg/sqft
Highest 21%
| 1,766 tons
Highest 27%
|
|
CC Care (Community Care Center)
4314 S Wabash Ave
| Senior Living Community | 8.8 kg/sqft
Highest 21%
| 549 tons
Lowest 31%
|
|
The Claridge at Cicero
4437 S CICERO AVE
| Senior Living Community | 8.8 kg/sqft
Highest 21%
| 870 tons
Lowest 50%
|
|
Clarendon Shores
4750 N CLARENDON AVE
| Multifamily Housing | 8.8 kg/sqft
Highest 21%
| 450 tons
Lowest 22%
|
|
FBI Chicago Field Office
2111 W Roosevelt Rd
| Office | 8.8 kg/sqft
Highest 21%
| 4,029 tons
Highest 9%
|
|
Norville Center - Gentile Center-ID#254171
6526 N Winthrop
| College/University | 8.7 kg/sqft
Highest 21%
| 1,115 tons
Highest 41%
|
Data Source:
Chicago Energy Benchmarking Data