Electrify Chicago
An independent tool for viewing City of Chicago building data
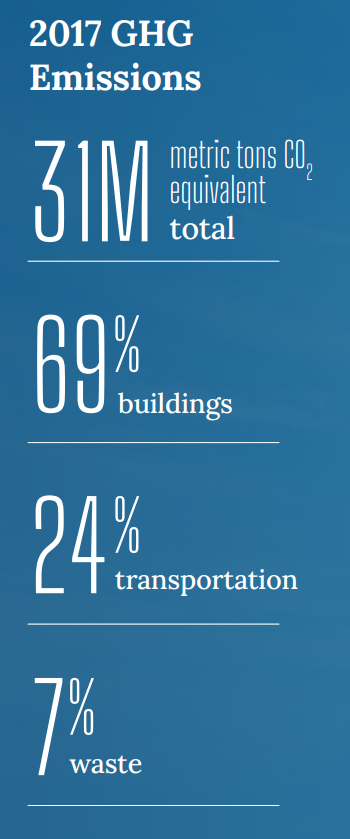
According to the
2022 Chicago Climate Action Plan ,
a whopping 69% of Chicago's emissions come from buildings, making it
our biggest challenge and our biggest opportunity as a city to tackle
change. At Electrify Chicago, we want to showcase some of the best and worst performing
buildings in the city using publicly available data and manual annotations to add
building photographs and label multi-building owners like universities.
,
a whopping 69% of Chicago's emissions come from buildings, making it
our biggest challenge and our biggest opportunity as a city to tackle
change. At Electrify Chicago, we want to showcase some of the best and worst performing
buildings in the city using publicly available data and manual annotations to add
building photographs and label multi-building owners like universities.
You can start by looking at Chicago's buildings with the highest greenhouse gas intensity - this means that they use the most energy when adjusted per unit of square foot, so big buildings could actually perform much better than very inefficient small buildings on this metric.
New Article
📰 $30 Million In Missed Fines
The City Of Chicago failed to collect $30 million in potential fines from the building benchmarking ordinance, reducing transparency and accountability.
Legislative update! 🎉
As of late January 2024, legislation is being introduced to require new use more efficient forms of water and space heating, via the Clean And Affordable Buildings Ordinance (CABO), which will reduce the number of highly polluting and inefficient buildings that end up on this site.
If you're in Chicago,
write to your alderman to support the CABO!
Chicago Buildings by Greenhouse Gas Intensity
Note: Data only includes large Chicago buildings from 2021, unless explicitly stated otherwise.
Note: This data only includes buildings whose emissions are reported
under the
Chicago Energy Benchmarking Ordinance. According to the City “As of 2016,
this list includes all commercial, institutional, and residential buildings larger than
50,000 square feet.” This dataset is also then filtered to only buildings with
reported emissions > 1,000 metric tons CO2 equivalent.
This data is also from 2021, but when new benchmark data is available, we'll update the site.
| Property Name / address | Primary Property Type |
Greenhouse Gas Intensity (kg CO2 eq./sqft) |
Total Greenhouse Emissions (metric tons CO2 eq.) |
|---|---|---|---|
|
03441- Chicago, IL
2940 N Ashland Ave
| Supermarket/Grocery Store | 23.6 kg/sqft
Highest 2%
| 1,753 tons
Highest 27%
|
|
Dunning Square
6408 - 6450 W Irving Park Rd
| Strip Mall | 23.6 kg/sqft
Highest 2%
| 3,036 tons
Highest 13%
|
|
8799
(Northwestern)
710 N Fairbanks Ct
| Laboratory | 23.4 kg/sqft
Highest 2%
| 4,364 tons
Highest 8%
|
|
Fifth Third Arena
1801 W Jackson Blvd
| Ice/Curling Rink | 23.3 kg/sqft
Highest 2%
| 2,969 tons
Highest 14%
|
|
00202- Chicago, IL
2550 N Clybourn St
| Supermarket/Grocery Store | 23.3 kg/sqft
Highest 2%
| 1,984 tons
Highest 23%
|
|
Technology Business Center
3440 S DEARBORN ST
| Office | 23.3 kg/sqft
Highest 2%
| 3,363 tons
Highest 11%
|
|
03224- Chicago, IL
6430 W Irving Park Rd
| Supermarket/Grocery Store | 23.2 kg/sqft
Highest 3%
| 1,333 tons
Highest 35%
|
|
8792
🚩
303 E Chicago Ave
| Laboratory | 23.0 kg/sqft
Highest 3%
| 6,980 tons
Highest 4%
|
|
3030 North Broadway BU #21190
3030 N BROADWAY
| Enclosed Mall | 23.0 kg/sqft
Highest 3%
| 3,025 tons
Highest 13%
|
|
ECD Great Street LLC
201 N State St
| Hotel | 22.9 kg/sqft
Highest 3%
| 3,042 tons
Highest 13%
|
|
Gateway to West Loop
16 - 40 S Halsted St
| Supermarket/Grocery Store | 22.8 kg/sqft
Highest 3%
| 2,182 tons
Highest 20%
|
|
53100516--CHICAGO
2112 N ASHLAND AVE
| Supermarket/Grocery Store | 22.8 kg/sqft
Highest 3%
| 1,825 tons
Highest 25%
|
|
03349- Chicago, IL
2520 N Narragansett Ave
| Supermarket/Grocery Store | 22.8 kg/sqft
Highest 3%
| 1,466 tons
Highest 32%
|
|
1124 Royal Sonesta Chicago River North 505 North State St
505 N State St
| Hotel | 22.7 kg/sqft
Highest 3%
| 2,452 tons
Highest 18%
|
|
03376- Chicago, IL
370 N Desplaines St
| Supermarket/Grocery Store | 22.6 kg/sqft
Highest 3%
| 1,470 tons
Highest 32%
|
Data Source:
Chicago Energy Benchmarking Data